Smart Cities – Part II – The Climate Group Proposal
For this study, we will use a work well referenced in this context, which was carried out by the Climate Group. (https://www.theclimategroup.org/)
Companies such as Bell, Telefonica, Cisco, T-Mobile, BT, Nokia, Deutsche Telecom, Vodafone, Intel, Microsoft, Ericsson, Sun, Telenor and France Telecom among others make up the Climate Group.
It is a group of traditional companies in the information technology and telecommunications sectors. This group produced a work that was titled SMART2020 (THE CLIMATE GROUP, 2015), where it proposed a series of measures. These measures could potentially have a positive impact, i.e., would cause CO2 emission abatement in 5 specific areas. This would be done as a kind of empowerment for other areas, other industries via sustainable technologies. This training would act as an “Enabling Effect”, in addition to the intrinsic reduction itself to the technology industry. The areas with great benefits would be:
- Smart Buildings
- Smart Engines
- Smart Logistics
- Smart Electrical Networks
- Dematerialization (effect studied separately, but counted in fractions in Intelligent Buildings, Smart Logistics and Intelligent Electrical Networks)
- Direct Impacts on ICT plants and services (Information Technology and Communications)
The Climate Group proposal sought to understand a reasonable number of successful cases of these types and emission reductions according to each type of proposed modification and always using tools provided by a new technology, establishing potential reductions in existing processes. A broad work was done with projecting an average gain per process, volume of processes per region according to each type.
Regarding the methodology for creating the abatement data, and proposing the transformations in each sector, the group defined actions as follows (which will be exemplified in Synthetic Tablets below).
Table — Methodology for Creating Emission Reduction Data
|
Standardize |
ICT can provide information on the standard forms of energy consumption and emissions |
|
Monitor |
ICT can incorporate the monitored information into the design and control for energy use |
|
Account |
ICT can provide capacities and platforms for energy and carbon accounting |
|
Rethink |
ICT can offer innovation for energy efficiency in buildings / residences, transportation, power generation, manufacturing, and other infrastructures and provide alternatives to the current models of operation, learning, life, work and travel |
|
Transform |
ICT can provide intelligent and integrated approaches to energy management of systems and processes, including benefits in both behavioral and automation changes, and the development of alternatives for emissions-intensive activities |
Direct ICT Contributions
Analysis of ICT Contribution Segments in CO2 Reduction
The ICT sector contributes almost 2% of CO2 emissions directly. This contribution includes the infrastructure of Telecom operators (central plants and communications transmission units), corporate data centers, and individual use devices such as personal computers, printers and other peripherals. This subdivision is drawn below in different colors: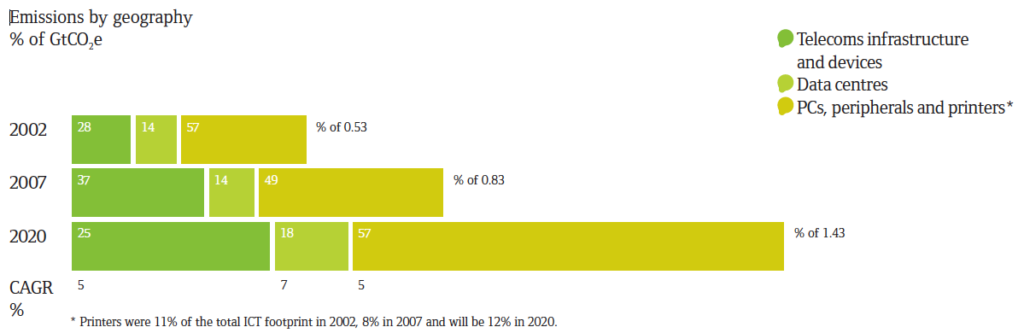
There are 3 lines in the chart: 2002 and 2007, which gather historical data of Giga Tons of Equivalent Gases (CO2e); and 2020, which projects growth according to the current trend, without changes of product types; differences in consumption; etc. The CAGR line means Compound Annual Growth Rate (5%, 7% and 5% respectively for “Infra-Telecom”, “Data Centers” and “People and peripheral computers”). Thus, in 2020, the ICT sector will be responsible for 1.43 GtCO2e, against 0.83 GtCO2e in 2007 (practically double the emissions). And in 2020, for the “PCs” sector, we will leave the 2007 level from 49% of the weight in this subsector to 57%, in this case, considering 100% as the entire ICT sector.
The study also breaks the charts by geographic area as follows: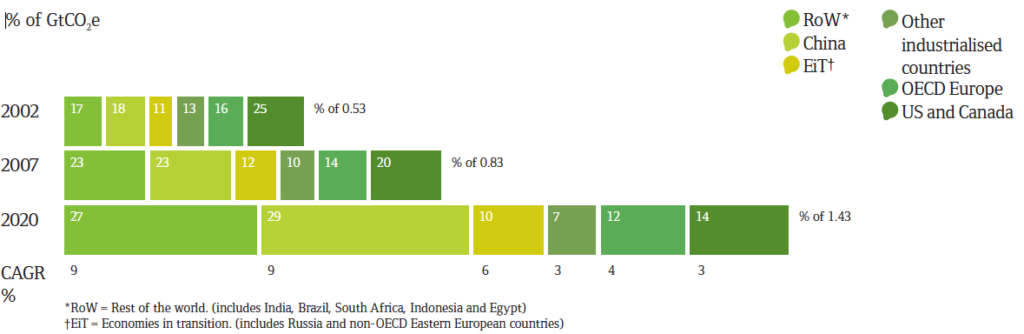
Figure — From Climate Group: Global ICT Footprint, by World Regions
We observe here for the same “shape” of the 3-line chart, one break by region. In this case, one notices the increase in a higher rate of China; of the “ROW” group (Rest of the World), which includes most of the developing countries and a negative growth rate of developed nations such as USA, Canada and Western Europe.
This is because, in the first block, the penetration of technology will grow even more than the population in the decade, while in the second block, the change with more effect will occur with the technological advance, in the exchange of facilities and equipment with more efficient use of energy and minor plant use.
And how does the study calculate each increase? They are compositions of prognosis and tendencies of the various sectors. For example, just talking about PCs, we are expected to jump from 592 million in 2002 to over 4 billion in 2020. With regard to culling, a large-scale replacement of Desktops with Notebooks (a much-noticed process) is expected less as well as LCD replacement for traditional monitors (also perceived process, which generates lower consumption per unit). The “carbons” in the generation of each item are also taken into account. Thus, the numbers are consolidated in each subitem until the graph is formed, either by subsector or by region.
Although not in the plan for this work, we could extrapolate national data in detail and enable a substrate of this basis for national potentialities. By adding our prediction of population penetration into each technology, consumption data of new technologies, we would obtain the extrapolated national calculation for the same chart of the Climate Group.
Effect on Other Sectors
ICT giving capacity to Reduce Gases to Other Sectors
The Climate Group conducts a study for slaughtering in other industries and services via technology. As a summary of CO2e reduction indirectly by the ICT industry can be considered an accounting of the 4 large groups:
- Industry – Intelligent Engines and Industrial Processes – Potential 1,1 GtCO2e Reduction by 2020
- Energy – Use of Intelligent Electrical Networks and Energy generation efficiency; cogeneration, etc.; – with Potential Reduction of 2.1 GtCO2e by 2020
- Facilities – Including Intelligent Buildings, Intelligent Electrical Grids, Dematerialization, Intelligent Transport – Potential 2.4 GtCO2e Reduction by 2020
- Transport – Including Intelligent Transport, Optimization of Transport Network, Dematerialization, Efficient (and Alternative) Vehicles, and Traffic Monitoring, Planning and Automation – Potential Reduction of 2.2 GtCO2e by 2020
This will be detailed, plus an important item that permeates all other segments, not being highlighted in this chart, would be the dematerialization. Before entering the items, there are some comments about dematerialization. What would the Dematerialization effort be? It would take place on 5 main fronts:
- Online Media – Replacing conventional media manufacturing such as CD Players, DVD players, etc.
- Online Trading – Replacing forms and consumer and producer forms printing, avoiding offset
- Electronic Document – Avoiding printing of private or public documents.
- Videoconferencing – Avoiding transportation to meetings of various types. Using open or private computing networks and installation enabled.
- Home-Office and Flexible Work – Avoiding or changing the pattern of routine shifts to work environments through virtual meeting, online collaboration, etc. Using open or private computing networks and installation enabled.
Dematerialization is, however, accounted for in the other items of this study.
Smart Motors
Analysis of ICT Contribution Segments in CO2 Reduction
It follows an Figure from the study of the Climate Group, in what form ICT can contribute in the generation of intelligent motors and industrial automation that is proposed. In the chart below, the group subdivides rebates into the smart engine industry and reviews in industrial cycles: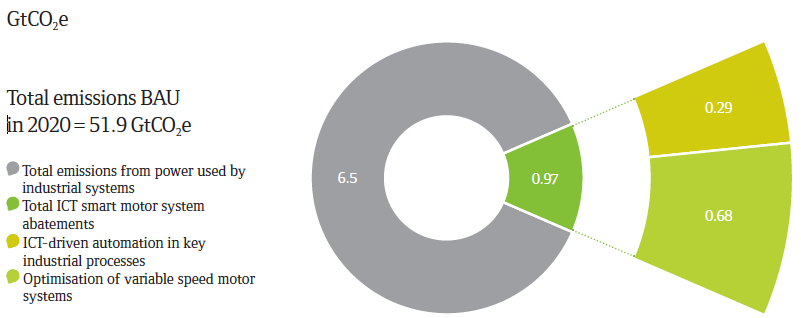
The following table summarizes see this idea and then some highlights that are highlighted later.
|
SMART motor systems: The role of ICT |
||
|
Standardize, Monitor & Account |
Rethink |
Transform |
| Monitoring of energy consumption and energy savings | Optimization of motor systems by using information on required output of motor system | System intelligence and integrated control of devices across the plant and the wider business |
| Central repository of energy consumption data | Optimization of industrial systems by receiving information at the factory level on actual output of all motor systems in real time | Integration with sales and logistics |
| Transfer of energy consumption data to local and central governments for regulatory compliance | Remote and centralized control of VSDs (central intelligence providing instructions to VSDs) | |
| Analysis of energy consumption data | ||
As shown in the pizza chart of the Enabling Effect distribution, this sector would hold 0.97 GtCO2e of potential slaughter in 2020, from the projected 51.9 GtCO2e (without further slaughtering). Of these 0.97, 0.29 GtCO2e would be in automation of industrial processes and 0.68 GtCO2e would be for transformations in intelligent motors.
The study is often used in the Electronic Devices / Variable Speed Drives (VSDs)
The study’s projections are based on increased efficiency, cleaner production, review of industrial processes, more efficient energy cycles, review and energy / exegetical balance, cogeneration, etc. which we study in the scope of environmental technology, but on the perspective of how ICT can contribute.
Concrete contributions, typical would be: Application VSDs; Process simulators; Integration between different production systems in the same plant; Design applied; Alignment of plant systems with business; monitoring of regulatory goals through translation into real-time process controls, etc.
VSDs modify a given industrial system by reducing inputs or cycle times. VSDs typically assume self-learning with the optimal metric system such as cycle durations, velocity, temperature, pressure, etc. within a region of safety and certain operating efficiency possible in each system.
Smart Logistics
Analysis of ICT Contribution Segments in CO2 Reduction
Smart logistics would be responsible for 1.52 GtCO2e reduction (within the 51.9 GtCO2e totals projected for 2020).
This sector is divided into several according to the series presented in following figure.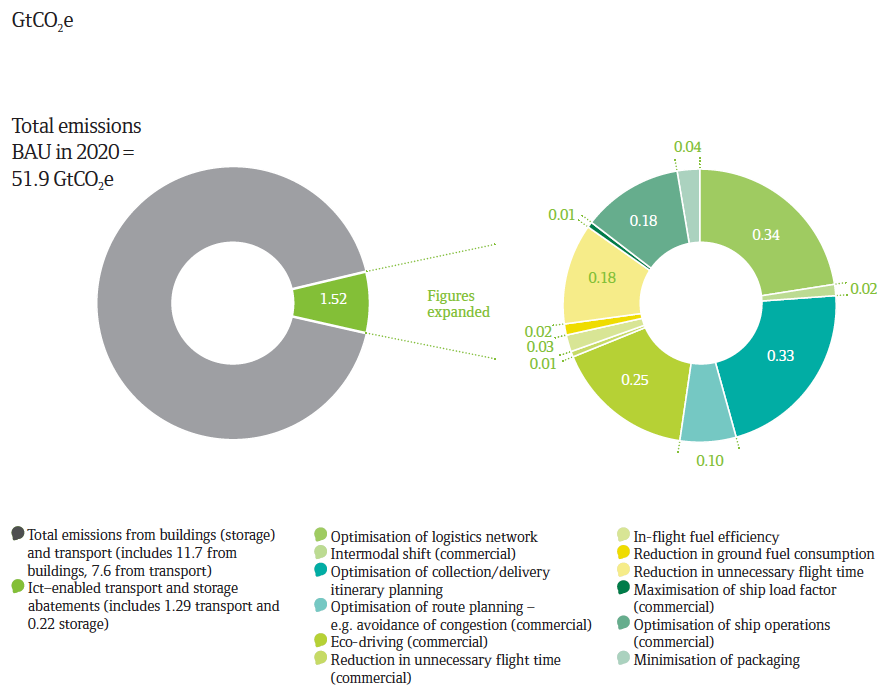
Regarding the methodology of transformation towards the Smart Logistics we would have as detailed below.
|
Smart Logistics: The Role of ICT |
||
|
Standardize, Monitor & Account |
Rethink |
Transform |
|
Tag and track inventory, stock and other items throughout the supply chain |
Increase communication between devices and between logistics providers and suppliers |
Vehicle and load management systems to identify unused capacity within the supply chain |
|
Track local terrain and information for understanding of optimal routes |
Optimize and control inventory to reduce vehicle miles in delivery or returning stock to the manufacturer |
Reverse logistics to allow the back-loading of vehicles on the network and for the return of unsold/damaged goods to the supplier |
|
Information systems to provide the driver with real time information about the vehicle’s efficiency and behavior |
Model and optimize distribution network design throughout supply chain design |
Apply systems thinking from production to consumer to end of life |
|
Conduct stock repair tasks on behalf of the manufacturer |
||
|
Manage day to day operations with real time data |
||
|
Track efficiency against business performance |
||
|
Technologies and Services for Smart Logistics |
||
|
Radio frequency identification (RFID) for asset tracking |
Broadband networks |
CO2e emissions tracking platforms |
|
Geographical information systems (GIS) to combine sensing with geographical terrain |
Messaging platforms enable notifications between system components |
Electronic freight exchanges (EFX) to allow for the “auction” of spare space on vehicles |
|
Data recorders for vehicles |
Telematics |
Reverse logistics platforms |
|
Onboard driver information and data logging |
Supply chain design and modelling software |
Protocols for system interoperability |
|
Real time fleet tracking |
Real time route optimization (RTRO) software |
CO2 route optimization standards and software |
|
Global Positioning Systems (GPS) |
Collaborative planning, forecasting and replenishment (CPFR) systems |
E-commerce and other e-services |
|
Installed base management platforms |
||
|
Vendor managed repair (VMR) platforms; also known as maintenance, repair and operating (MRO) |
||
|
Business and operational support systems (BSS / OSS) |
||
Smart Buildings
Analysis of ICT Contribution Segments in CO2 Reduction
Following is the chart that Climate Group has set for slaughtering in the area of intelligent buildings.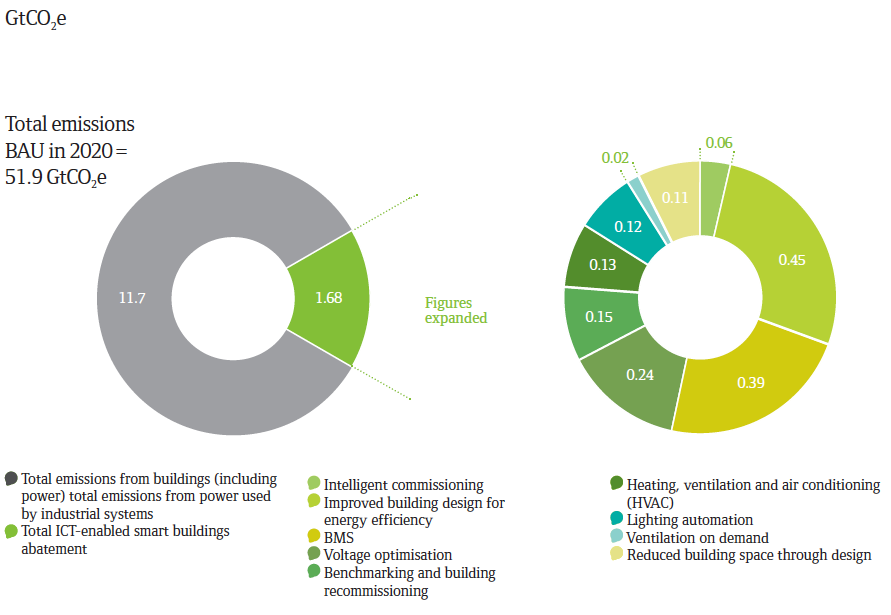
Note the 3 major items, “Intelligent Commissioning”, “Design”, and “Integrated Systems”, responsible for calculating 1.08 of 1.68 GtCO2 (65%) of subsector abatements. Following is the table for the analysis of intelligent buildings.
|
Intelligent Buildings: The Role of ICT |
||
|
Standardize, Monitor & Account |
Rethink |
Transform |
|
The ability to change the local conditions based on occupant behavior |
Recommission to find inefficiencies in BMS. The two areas of the greatest impact are lighting and HVAC |
Create a connected urban environment such that buildings are adjustable to human behavior |
|
Occupancy-based lighting |
Improve engagement and involvement from users |
Improved human-to-machine interface |
|
Demand control ventilation |
Building and energy management control systems (EMCS) |
Software to design the built environment systems from transport through to building use |
|
Correction of hardware controls |
Removal of software errors |
Teleworking and collaborative technologies to reduce need for office space |
|
Measuring building performance/networking |
Remote building management |
|
|
Modelling and simulating energy consumption |
Improvements to operations and maintenance |
|
|
Energy modelling from design through building use |
||
|
Technologies and Services for Smart Buildings |
||
|
Sensors for remote monitoring and measurement |
Building design and simulation software (e.g. temperature modelling, fluid dynamic modelling) |
Open standards for interoperability between different technology sets |
|
Chips and controllers for BMS |
BMS |
Automated whole building control systems (AWBCS) and automated whole building diagnostic systems (AWBDS) |
|
In-building network systems |
Implementation of building automation (e.g. shade control systems, motion-based refrigerator case lighting) |
Maintenance of energy generation services (e.g. photovoltaic energy supply) |
|
Building equipment (e.g. LED lighting) |
Interconnectivity between building systems (e.g. EMCS, lighting, security systems) |
Automated building code checking services |
|
Appliance interconnectivity and networking and remote appliance control |
||
|
Operations and maintenance of building communication systems |
||
Smart Grids
Analysis of ICT Contribution Segments in CO2 Reduction.
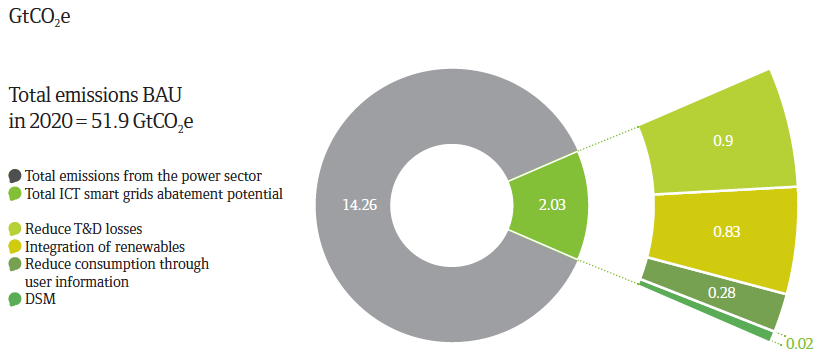
Below, the subject chart that may be the most complex to implement, that of smart grids, but with a significant impact on emissions reduction.
|
Intelligent Buildings: The Role of ICT |
||
|
Standardize, Monitor & Account |
Rethink |
Transform |
| Better information for consumers and producers of power | Better planning and forecasting | Support for and integration of renewables and distributed generation |
| Remote monitoring and measurement | Improved asset management | Intelligent dispatch |
| Improved energy accounting | Improved network design | Captive generation integration |
| Improved billing services | Remote grid management | Grid-to-vehicle solutions |
| Preventive maintenance | ||
| DSM | ||
|
Technologies and Services for Smart Grids |
||
| Sensors for remote measuring, chips and controllers for monitoring | Grid management systems (e.g. supervisory control and data acquisition (SCADA) and output management system (OMS)) | Protocols for grid-wide system interoperability |
| Smart meters (advanced metering infrastructure (AMI) or automatic meter reading (AMR)) | Asset inventory and network design systems (e.g. GIS tools) | Operations and maintenance of grid communications systems |
| Energy accounting software | Load analysis and automated dispatch software | Advanced telecommunications to allow distributed energy producers to pool resources and to handle spikes in supply and demand |
| Smart billing software – IP-based billing or prepaid metering | Workflow management systems for the grid | New platforms (e.g. ETS) |
| Performance contracting applications | ||
| Demand response software that allows automated load maintenance | ||
Conclusion
Smart cities, together with digital citizenship, form public governance around digital transformation, since other initiatives that have been mentioned bring a greater focus on the management of private companies, technology pioneers, IT or Telecommunications.
The economy is called the “Smart” type, recycle the idea of production of goods, execution of services supported by digital processes.
The Sector that supports the transformation of companies with technology bets on the idea of Smart Economy and offers the tools for such, either through software, equipment with a digital reengineering for new processes.
With government programs, environmental regulations and compliance, companies are seeking to adhere to this new method. Otherwise, it is also a matter of image and transfer to its own consumer, who now requires more products and services with an environmental seal, in a formal or non-formal way.
The entire industry is organized with professionals in this area, managers, legal experts and providers of transformational technology to offer in the coming years innovative possibilities for society across the globe to enter the Smart Economy and the idea of “Smart”. Many cities today place their “Smart” program as a differential of public policy, administration, aiming at a goal of citizen well-being, as well as electoral, tourist or economic goals.
There are many examples of smart cities in the world, with innovative programs with the Smart idea. There is also a wide transfer of experiences in this sector, different from the private sector. Providers in turn take advantage of this exchange by offering their solutions to other cities that replicate some Smart program from another more mature city.
It is undoubtedly an area of great attention for investments and evolution of careers, strongly linked to digital transformation.
(to be continued)
About The Author
Renato Botto
BSS OSS Innovation & Tech